


")
")


Objectives
Within this ESA / ESTEC project, GPS measurements at high sampling rates (50 Hz) have been recorded in both high and low latitude regions. A data base has been constituted. These data have been used to derive the scintillation characteristics and improve scintillation models.
Additional points to this study include the analysis of data from IGS network, the generation of time series corresponding to scintillation samples in order allowing receiver testing and the development of one forecast model allowing obtaining scintillations maps.
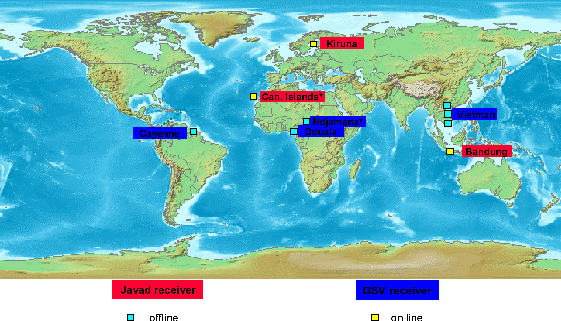
Receivers deployment
The locations of the different receivers are indicated on the figure below. For some of them, we had an internet connection. For the others, the data recorded was sent by regular mail. Two kinds of receivers have been used: GSV and Javad. GSV receivers include an algorithm which extracts the scintillation parameters, namely the intensity and phase indexes every minute. An equivalent algorithm has been developed to extract these parameters for the Javad receivers.
Features
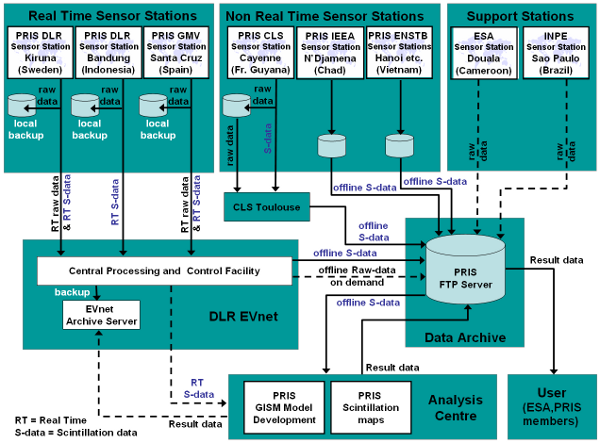
The constitution of a data base has been made according to the figure below using DLR EVnet system. A dedicated PRIS FTP server has been developed.
The data flows are of three kinds: on line stations with raw data files, off line with pre-processed files and historical data.
Software outputs are an improvement of GISM model and the definition of a forecast model to build scintillation maps.
Expected Main Benefits
This is the first time that such a work was realized in Europe. The team has fulfilled all the objectives of the study which were to install and operate scintillations receivers, mainly in equatorial regions, collect scintillation data, perform a relevant data analysis and improve the models. This work was highly valuable regarding all these aspects and will constitute a reference for such studies.
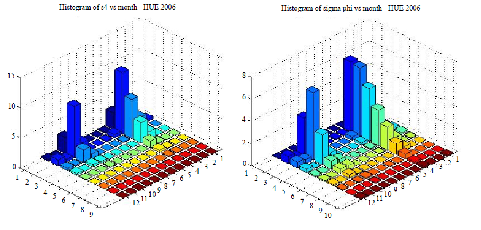
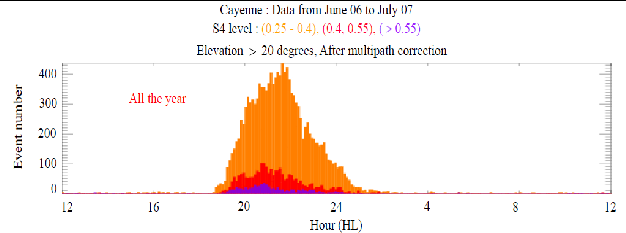
The figures below show the dependency on the season and on local time measured respectively in Vietnam (measurements by IETR, Rennes U. and ENSTB, Brest U.) and in Cayenne (measurements by CLS, Toulouse).
Of particular interest were the data from Vietnam and Indonesia. These four stations were located approximately at the same longitude allowing consequently obtaining global maps of this region which covers the equatorial anomaly.
The figure below presents the maps built from the measurements (right panel) and obtained with GISM model (left panel). This model has been improved during the study taking advantage from a better knowledge of some of the medium parameters. The vertical axis is the geomagnetic latitude from -25° to 20°. The horizontal axis is the local time at the Ionosphere Pierce Point (IPP).
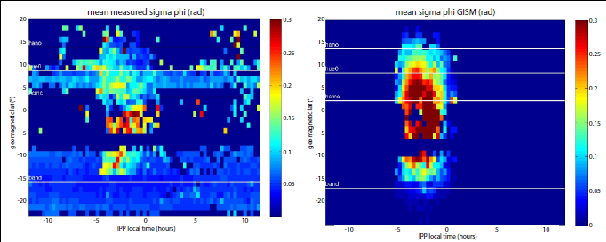
The plots show clearly the relationship between the equatorial anomaly and the scintillation region extent. The horizontal stripes between -25° and -10° and between 4° and 10° correspond to the multi paths in Bandung and in Hanoï. This kind of plot allows separating the different contribution: scintillation, geostationary satellite contribution when present and multi-paths.
Project Status :
completed on 15 march 2008.
Project Partners :
 |
 |
 |
|